6.SP.1 Statistical Questions
Recognize a statistical question as one that anticipates variability in the data related to the question and accounts for it in the answers. For example, “How old am I?” is not a statistical question, but “How old are the students in my school?” is a statistical question because one anticipates variability in students’ ages.
6.SP.2 Understanding Data
Understand that a set of data collected to answer a statistical question has a distribution that can be described by its center, spread/range and overall shape
6.SP.3 Measures of Center
Recognize that a measure of center for a numerical data set summarizes all of its values with a single number, while a measure of variation describes how its values vary with a single number.
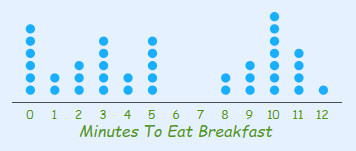
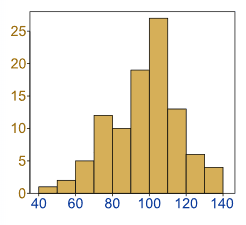
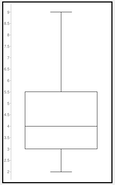
6.SP.4 Dot Plots, Histograms and Box Plots
Display numerical data in plots on a number line, including dot plots, histograms, and box plots. Choose the most appropriate graph/plot for the data collected.
6.SP.5 Measures (Mean, Median, Mode, Absolute Deviation)
Summarize numerical data sets in relation to their context, such as by:
- Reporting the number of observations.
- Describing the nature of the attribute under investigation, including how it was measured and its units of measurement.
- Giving quantitative measures of center (median and/or mean) and variability (interquartile range and/or mean absolute deviation), as well as describing any overall pattern and any striking deviations from the overall pattern with reference to the context in which the data were gathered.
- Relating the choice of measures of center and variability to the shape of the data distribution and the context in which the data were gathered.
|
|
I have assigned the practice in Khan Academy that I will be tracking.

|
All practice for this topic is in Khan Academy.
|
